DETAILFIG.01 · Item [08]
Scale 1:1Live·Next.js · Claude API
◇ Port Pulse
Live portfolio tracker from broker screenshots
8.1Overview
Port Pulse turns a screenshot of your broker into a live portfolio dashboard. Drop in a screenshot from any broker, let Claude vision extract your holdings, then watch the portfolio update against the live market: sector breakdowns, risk metrics, P&L per position, and a heatmap view sized by allocation.
No CSV exports, no manual data entry, no broker integrations. Screenshot in, live portfolio out.
8.2Features
- [01]Drop in any broker screenshot. Claude vision extracts every position
- [02]Live market prices via real-time quote feed
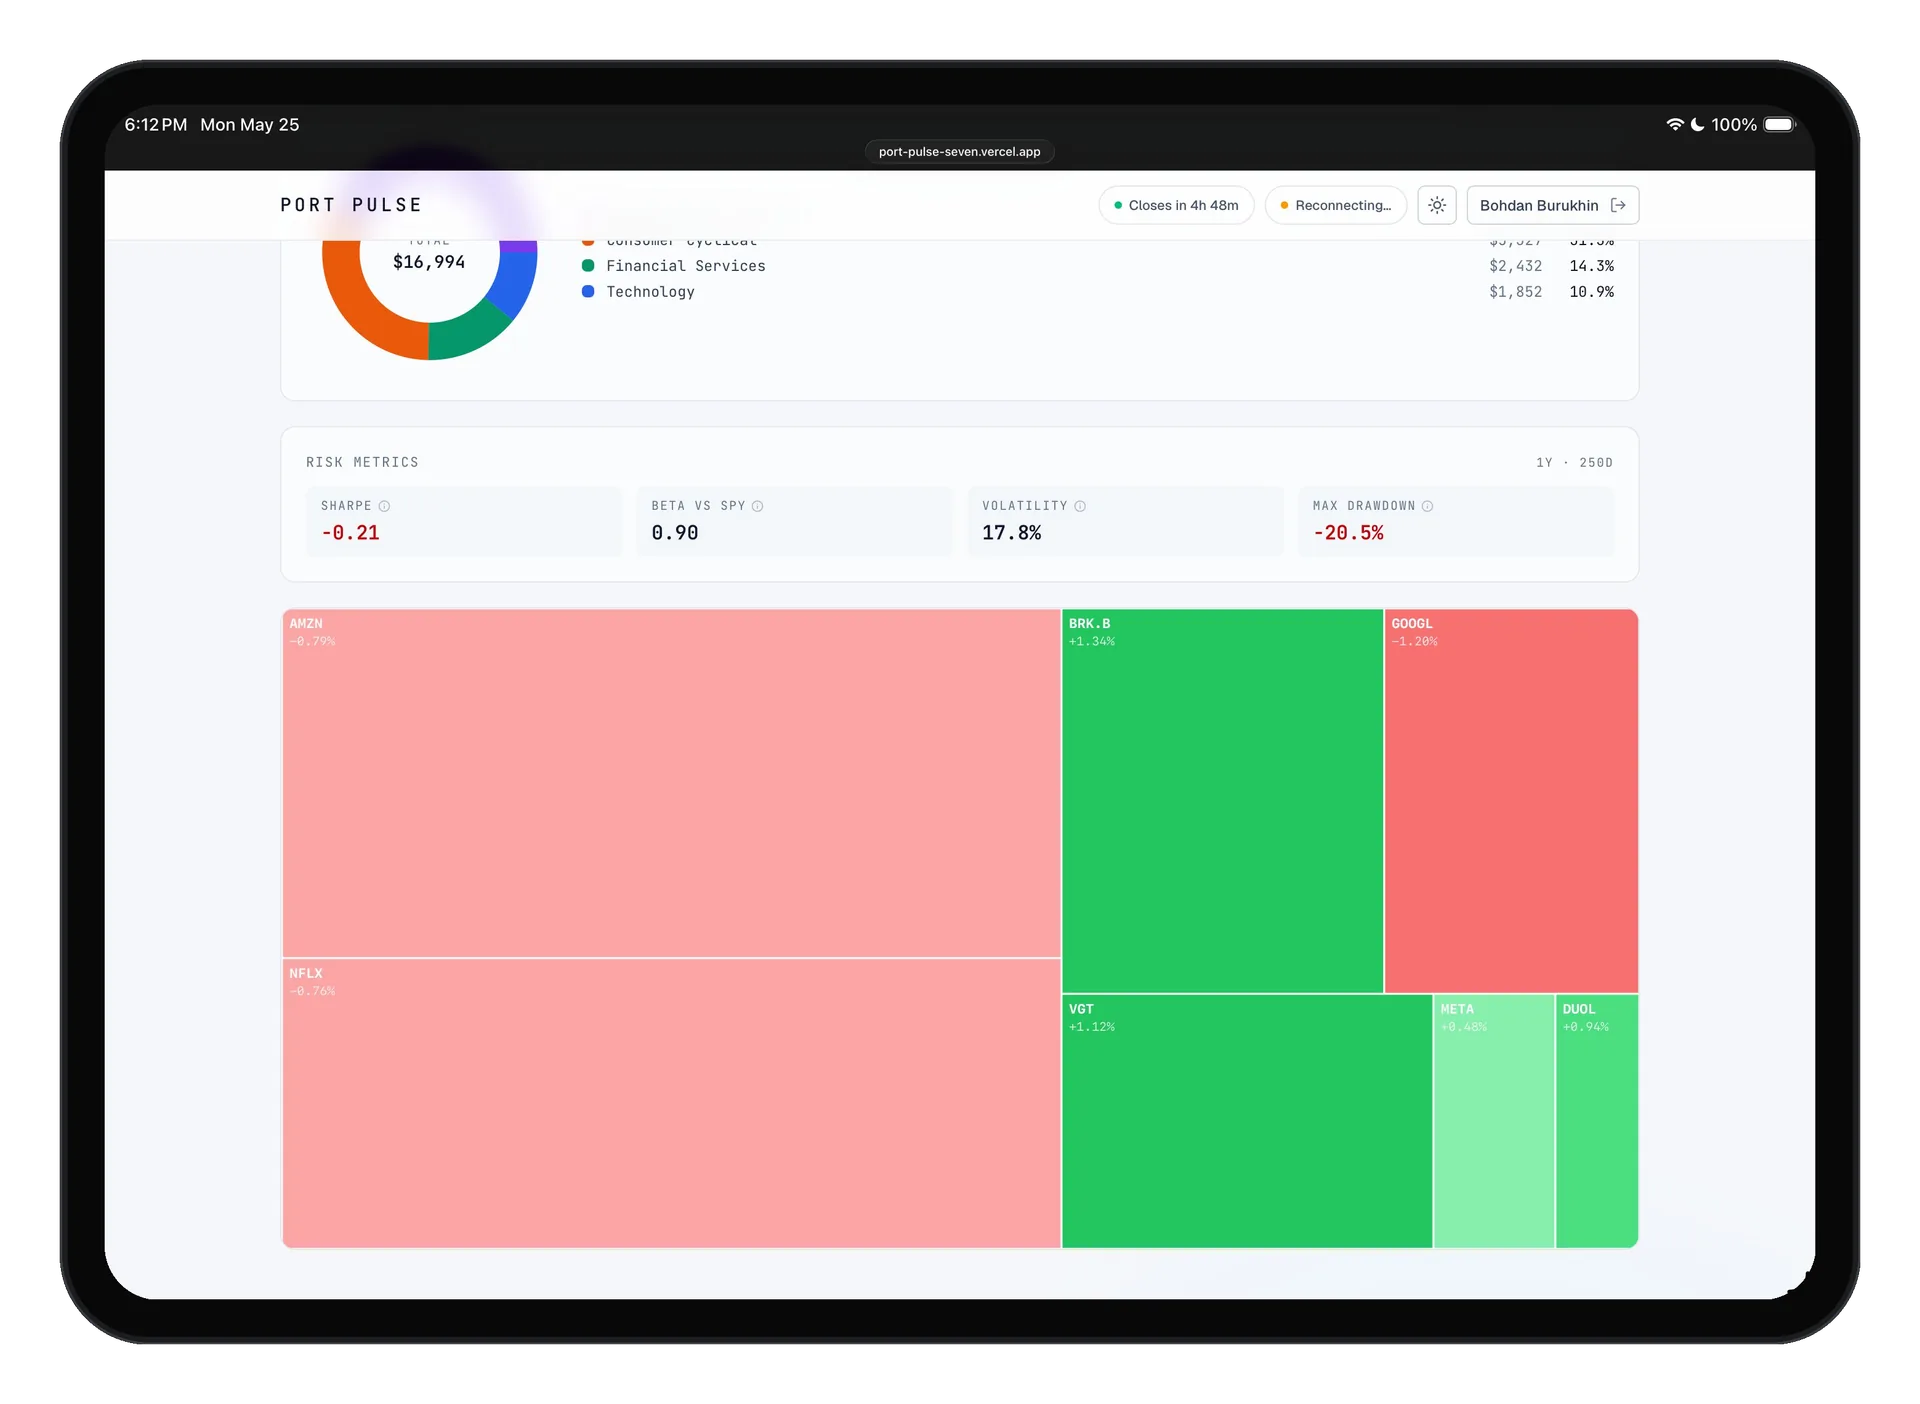
- [03]Table and heatmap views, switch with one tap
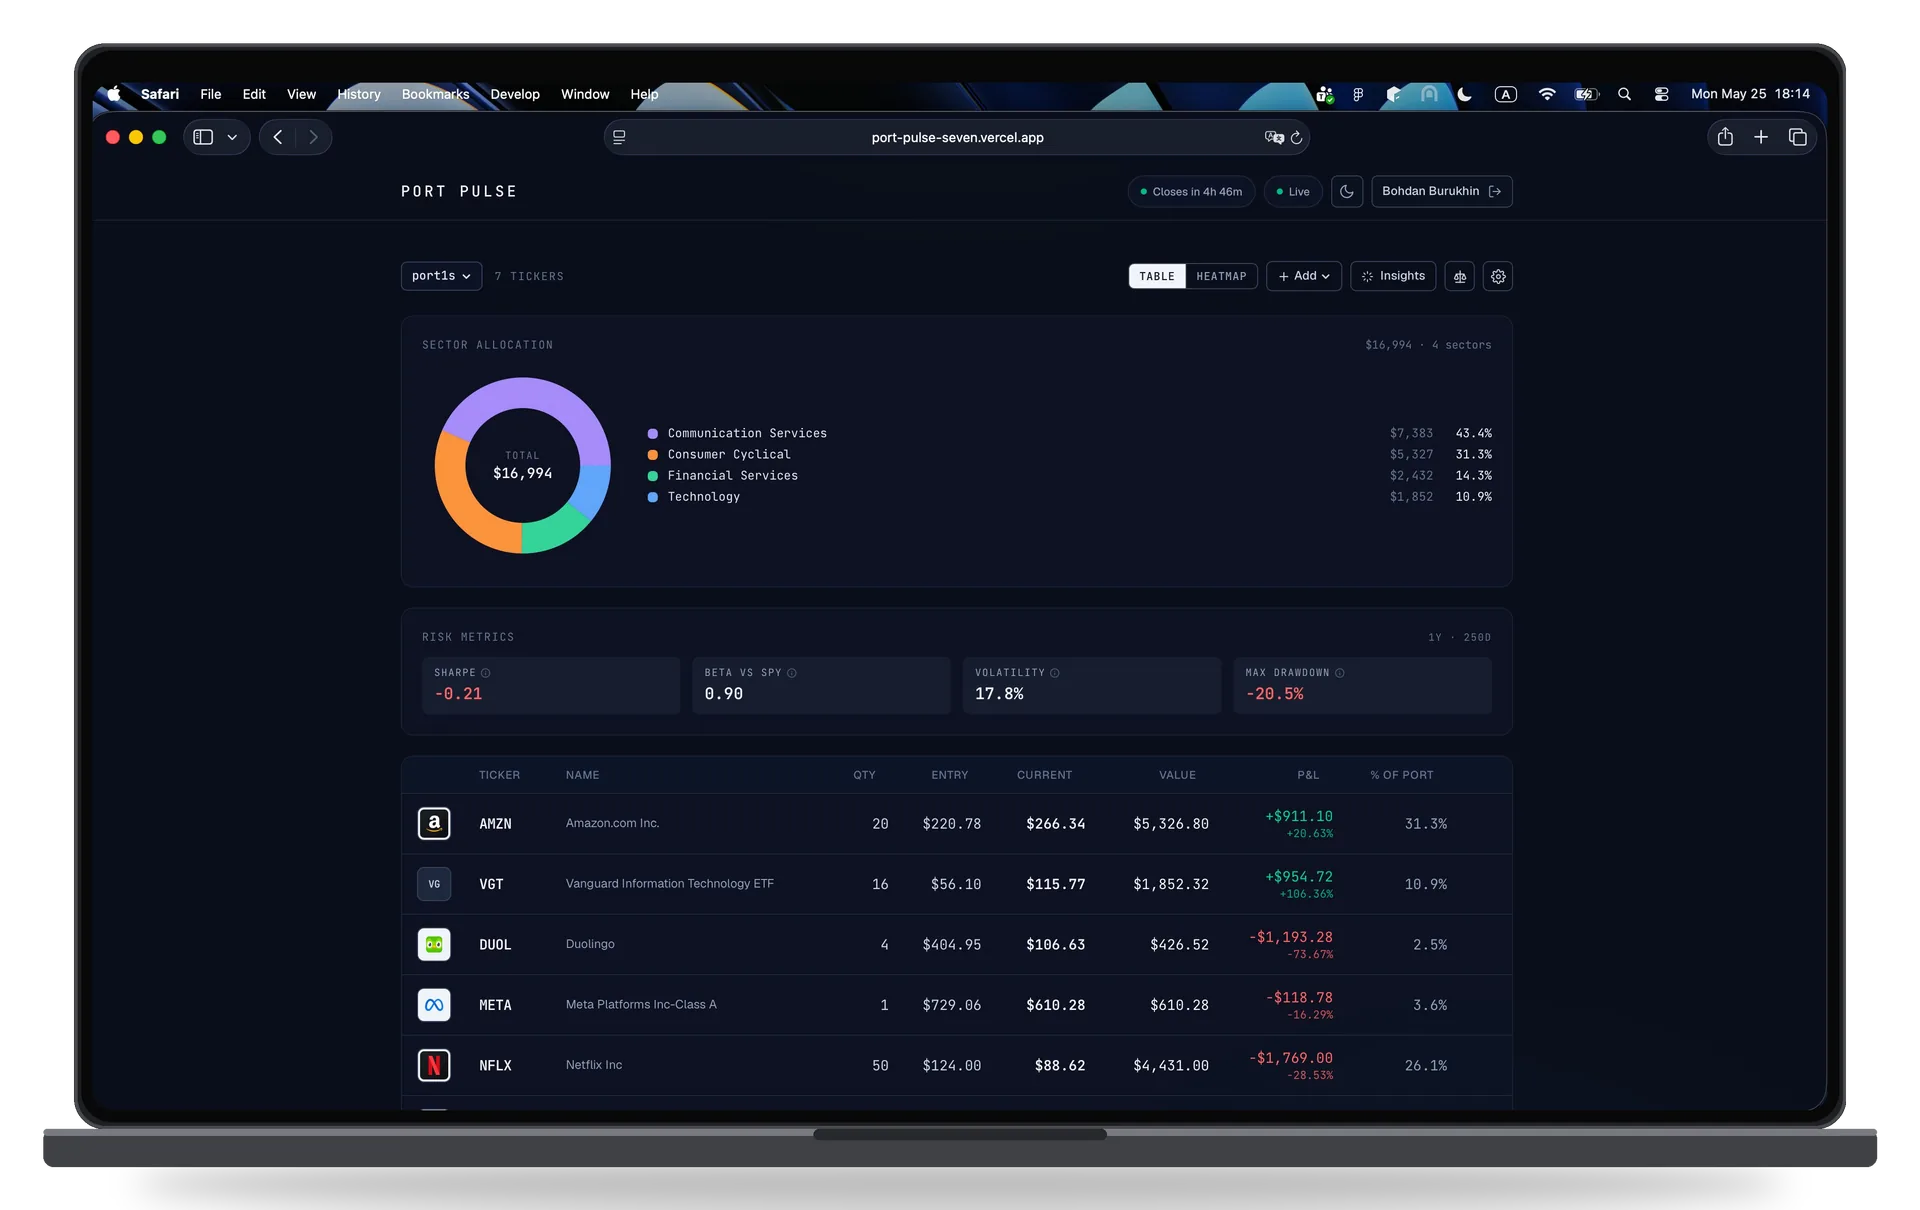
- [04]Sector allocation donut chart with totals and percentages
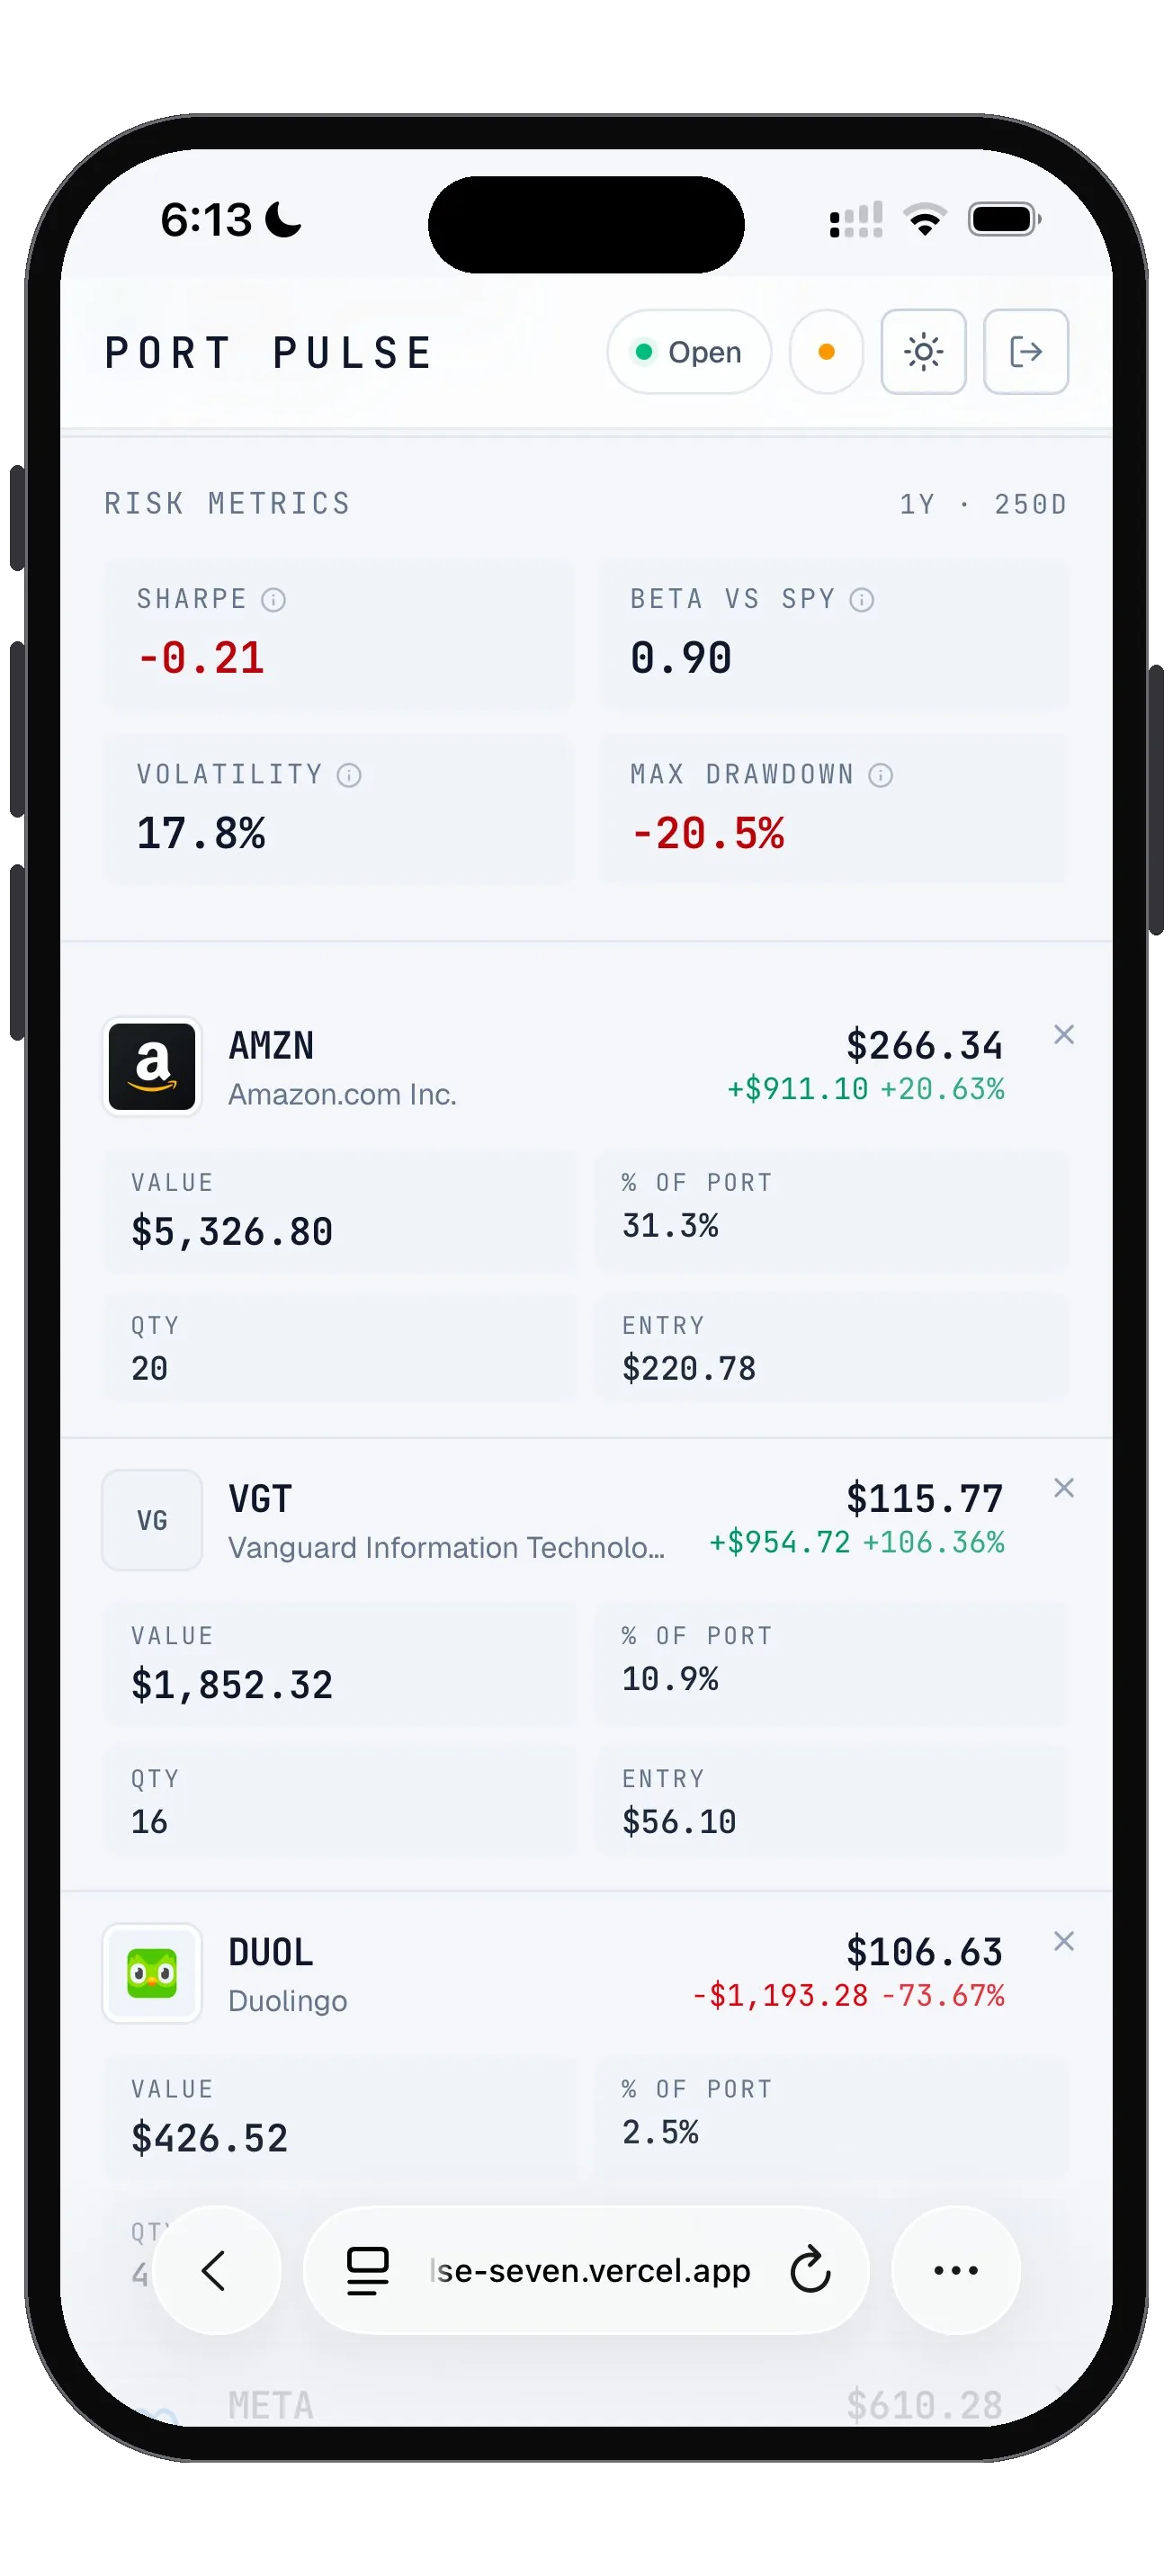
- [05]Risk metrics: Sharpe, Beta vs SPY, volatility, max drawdown
- [06]Per-position P&L with absolute and percentage change
- [07]Multiple portfolios, multi-symbol support
- [08]Light and dark themes, responsive phone to desktop
8.3Screens
SS-01· phone
SS-02· tablet
SS-03· desktop
Rev 2026.05·End of figure